Debugging Workflows
In Workflow Studio, you have the option to debug your designed workflows using either the CLR Debugger or Visual Studio. Debugging is a crucial step that allows you to examine your workflow code, observe its outcomes, and identify any potential issues.
This article will guide you through the process of debugging a workflow using Visual Studio, enabling you to efficiently troubleshoot and refine your workflow for optimal performance and reliability.
What You'll Learn
In this guide, you will:
- Compile and publish a workflow for debugging
- Open workflow source files in Visual Studio
- Attach the Visual Studio debugger to IIS worker processes
- Set breakpoints and step through workflow code
- Ensure debugging symbols match the deployed workflow
Prerequisites
This tutorial assumes you have Visual Studio installed and are familiar with basic debugging concepts. You must have access to the EmpowerID server where the workflow is deployed.
Debug Workflow
- Compile and publish the workflow you wish to debug to the Workflow Server and restart the Web Role Service.
- Start Visual Studio and from the File menu, select Open > File, navigate to
C:\Users\<YourUserFolder>\AppData\Local\EmpowerID\DataCommon\CompilerTemp, select the .cs file for the workflow you want to debug, and click Open. - Click No on the Inconsistent Line Ending dialog that appears.
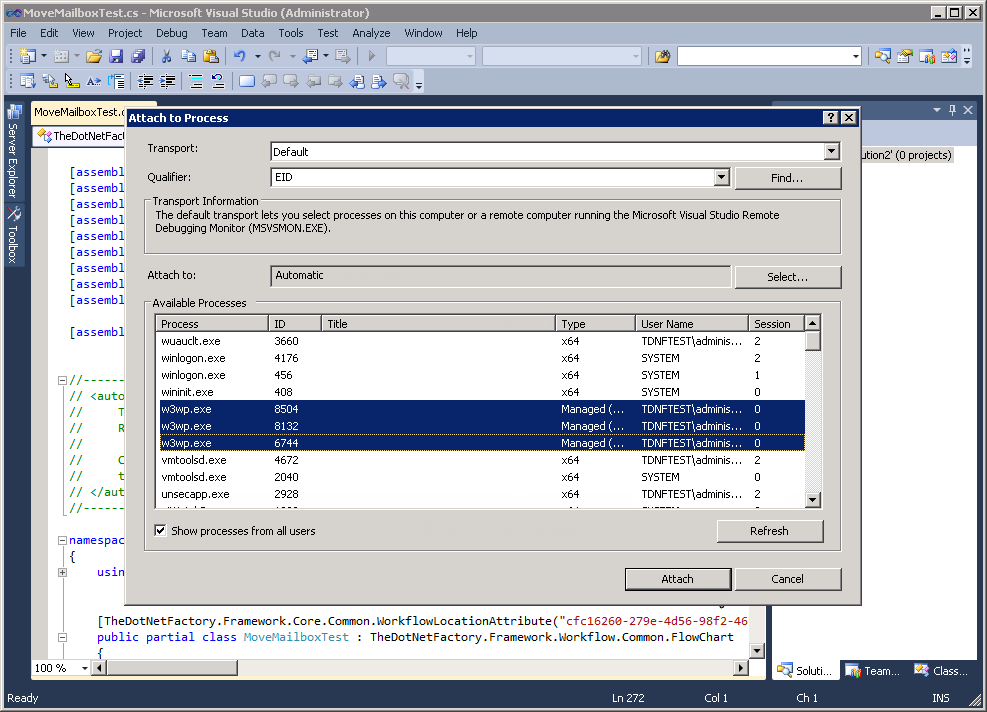
- From the Debug menu of Visual Studio, click Attach to Process, select all w3wp.exe processes in the Available Processes pane, and then click Attach.
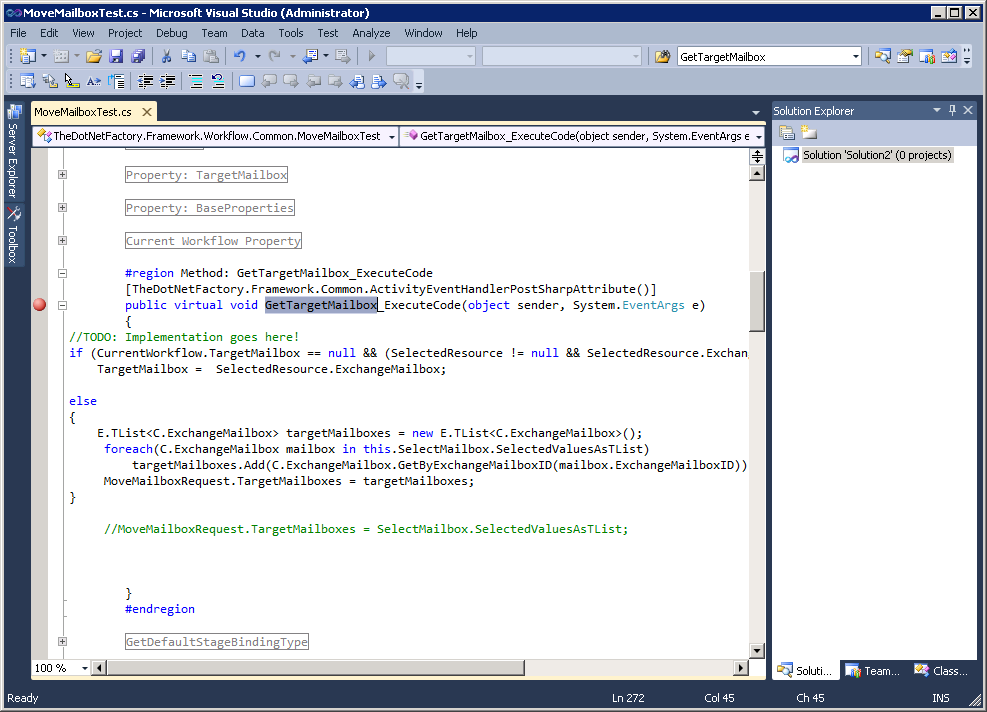
- From the .cs file for the workflow, place a breakpoint in the code editor where desired.
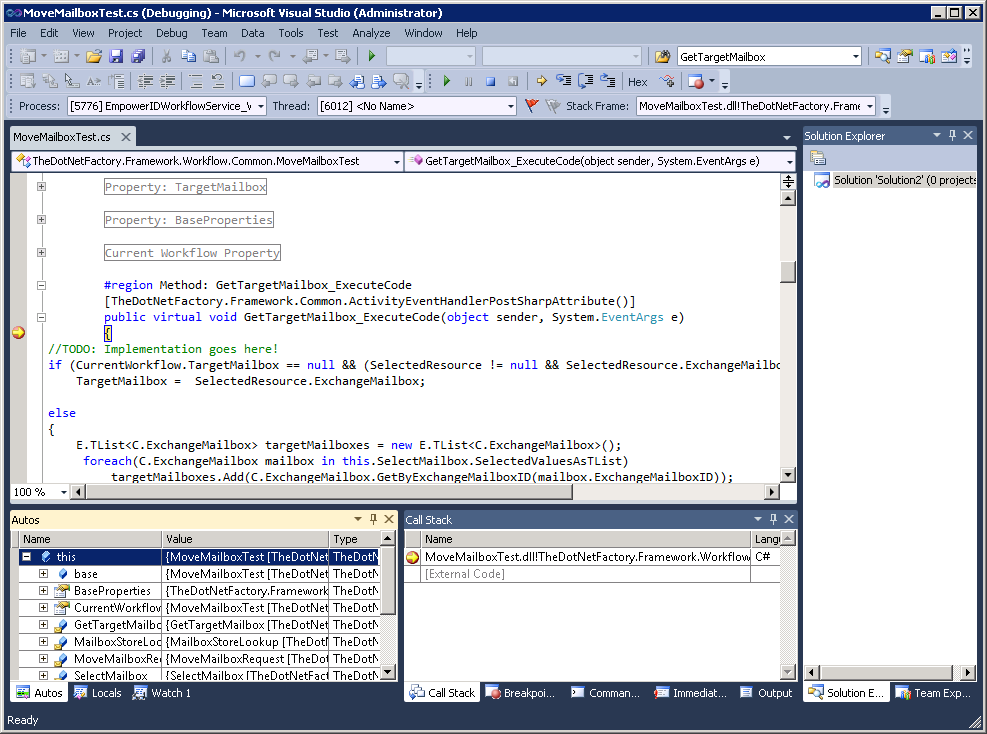
- Run the workflow. When the workflow process reaches the breakpoint placed in the .cs file, the process will stop, allowing you to step through the code and observe what is occurring from Visual Studio.
If you make changes to the source code for the workflow, be sure to republish the workflow. Otherwise, the symbols used when debugging will not match.